Physicists at Saarland University and the University of Bristol have now overturned that theory. The researchers were able to show that the striped pattern arises as a result of the cellular aggregation caused by the attractive forces acting between neighbouring red blood cells. Their research has now been published in the journal PNAS.
Patterns are to be found everywhere in nature – from the mesmerizing formations created by flocks of birds or shoals of fish to the unique swirls of our fingerprints or the distinctive stripes of a zebra. But what are the rules governing the emergence of such patterns?
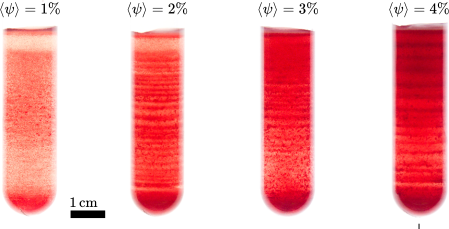
One clue to the answer may lie in the behaviour of red blood cells in a centrifuge. When separated in a centrifuge, red blood cells arrange themselves in a highly characteristic striped pattern. Viewed from top to bottom, we see a repeating pattern of alternating bands: a bright red stripe packed with cells, then a much paler stripe with fewer cells, with this red-white sequence continuing down the tube. For decades, the prevailing view was that red blood cells that have just been formed are rich in water and therefore less dense, which is why they rise to the top during centrifugation. The older blood cells, in contrast, sink to the bottom of the tube as they contain less water and therefore have a higher density because the haemoglobin remaining in them is heavier than water.
‘It was widely assumed that red blood cells lose water irregularly over their roughly 120-day lifespan, creating cohorts of different densities,’ explains Professor Christian Wagner, an experimental physicist at Saarland University. ‘The youngest cells contain lots of water, the middle-aged ones are less water-rich while the oldest blood cells have the least water. Cells in each group then clump together in similar regions of the centrifuged solution based on their respective densities, resulting in the typical striped pattern.’
The new study reveals a different story. ‘It’s not water loss, it’s intercellular aggregation,’ says Felix Maurer, a doctoral researcher who together with his co-supervisor Alexis Darras from the University of Bristol was a key contributor to the study. In their experiments, the team mixed red blood cells with water, salts and nanoparticles, then centrifuged them. ‘Just as weather balloons rise until they reach an altitude where the surrounding air is as light as they are, the red blood cells in the centrifuge tube settle at the level where their density matches that of the surrounding medium,’ Maurer explains.
The breakthrough came when they discovered that the pattern of alternating bands is the result of the vast number of cells involved. ‘The striped pattern only appears when huge numbers of cells interact. In our experiments, we had around a billion cells in the tube,’ says Maurer. By reducing the number of cells, the physicists observed completely different behaviour – the stripes vanished. ‘When the cells are farther apart, they don’t aggregate, i.e. they don’t stick together. Instead, they distribute themselves evenly throughout the tube and no stripes form,’ explains Felix Maurer.
In other words, it is the interplay between intercellular aggregation and the downward gravitational force that drives the formation of stripes. These new insights could pave the way for new diagnostic tools for blood disorders such as sickle cell anaemia, where cells become crescent shaped, dramatically altering their flow–and aggregation behaviour. ‘In sickle cell disease, the stripe pattern looks different, as was shown in a 2021 study, but until now, no one knew why,’ Maurer notes.
The research also shines light on a deeper more fundamental question: how do patterns and structures arise in nature? To answer this, the team developed a mathematical model that is based on dynamic density functional theory and that reflects their observations in the laboratory. ‘Similar equations are used to describe the patterns of zebra stripes, flocks of birds and even fingerprints,’ says Christian Wagner. Maurer adds: ‘In our case, short-range interactions between the cells produce a preferred stripe width and a preferred inter-stripe spacing. This sort of collective behaviour is also observed in flocks of birds in flight, where the formations arise from the simple rules governing how neighbouring individuals interact. A similar idea also applies to the formation of fingerprints.’
By carefully observing the behaviour of blood cells in the lab, the researchers have uncovered principles that help to explain the patterned beauty of the natural world.
Original publication:
F. Maurer, C. Romero, N. Lerch, T. John, L. Kaestner, C. Wagner, & A. Darras, Band pattern formation of erythrocytes in density gradients is due to competing aggregation and net buoyancy, Proc. Natl. Acad. Sci. U.S.A. 122 (51) e2515704122, https://doi.org/10.1073/pnas.2515704122 (2025).
Weitere Informationen:
Felix Maurer
Email: felixmilan.maurer(at)uni-saarland.de
Professor Christian Wagner
Tel.: +49 681 302-4676
Email: christian.wagner(at)uni-saarland.de